Description
This function allows to remove outliers from a dataset based on percentiles or standard deviation of one or multiple columns.
Application
Most data sources or data generating processes add some sort of noise or contain outliers which need to be cleaned so that models don’t get confused. To identify outliers and noise in your data you can use the Distribution function in the Explore section. Remove Outliers provides an easy way to remove outliers from your data.
How to use
- Create the step and assign a tabular dataset to it in the field Data.
- Select a Mode by which to define and remove outliers. Outliers can be either defined based on Percentiles or on Standard deviation (more on these modes below).

- Select all Columns which should be considered for the check.
- You can decide if you want to set the range for each column separately (default behavior) or if you want to apply the Same for all columnsby ticking the check box.
- By default a handler to set the range for outlier removal is appearing for each of the selected Columns.
- If the option Same for all columns is enabled, only one single handle appears and its settings is applied to all Columns.
- Set the ranges for outlier removal according to your dataset requirements (see more on setting the values below).
- You can choose if you want to overwrite the existing dataset by the result of this step or save it under a new name by dis-/enabling the option Save under new name.
- Click Apply to execute the step.
When the calculation is done the step is finished a distribution of the data is plotted (the plot is similar to the plots the Distribution function is producing). The data which is kept is plotted in red bars, the data points of the original dataset which were removed by the step are plotted in white. That way you see a before/after comparison of your distribution to quickly check if the desired result was achieved.

It is often not easy to find the right settings directly on first execution of this step. Very likely finding the right settings is an iterative process rerunning this step several times. That is, if too much or no data is removed by this step you simply re-enter the edit mode and adjust the settings to achieve the desired result.
Remove outliers based on Standard deviation
If Mode standard deviation is selected a numeric input handler appears.

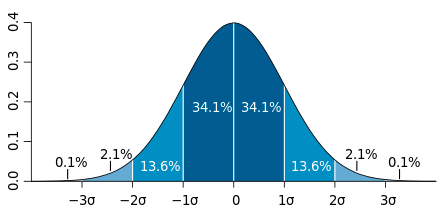
This is a positive filter. That is, the number entered describes the width of the data around the mean value of the data which will be kept. All data points within the range μ ± N ⋅ σ will be kept where μ is the mean value, N is the number chosen, and σ is the standard deviation.
That is, an input of 2 will keep all data within a range of ± two times the standard deviation around the mean value. This will be about 95.4% of the data (assuming that the data follows a normal distribution). That is, 4.6% of the data at the edges of the distribution will be removed (2.3% of the lowest and biggest value).
An input of 3 will keep all data within a range of ± three times the standard deviation around the mean value. This will be about 99.7% of the data (again assuming that the data follows a normal distribution). That is, only 0.3% of the data at the far edges of the distribution will be removed.
In the standard deviation mode data is always removed on both ends of the distribution. This mode works best if the data is approximately normal distributed.
Remove outliers based on Percentiles
A range slider to define the percentile range appears.

The range marked red will be kept. That is, in the screenshot above the smallest and biggest five percent of the data points will be removed. The lower bound of the range defines the percentage of data points which are removed at the lower end of the distribution (in the example 5%). Accordingly, the upper bound defines the percentage of data points which are removed at the upper end of the distribution (in the example also 5%).
Both numbers can be set independently. That is, it is possible to filter the data asymmetrically (e.g. 2 - 93) or filter only at one end of the distribution (e.g. 0 - 95 or 3 - 100).
To set the range you can shift the red points to the desired values or enter the numbers directly. For the later click on the box with the numbers on the right side. A new box appears with a text field. Here you have to enter two(!) values separated by a comma (lower bound, upper bound) and press enter. The range slider will be updated accordingly.
Examples
Consider the following tabular dataset with two columns (A and B).

The dataset has 20 steps in total (row 0 … 19). One data point represents 5% of the dataset that is a step of 5% on the percentile range would each time remove one more data point. As you see in the distribution plot all values are in the range of 0 … 10 in both columns. In both columns an outlier appears at value 20 which we would like to remove. As the dataset is very small and the statistic can be easily distributed that is quite easy in this case.

Apply Remove Outliers only to single column
The settings applied in this case are:
- Only remove Outliers for Column
A. - Mode: Percentile
- Percentile range: 0 … 95
- Don’t remove data at the lower end of the distribution.
- Remove one data point (which is equivalent to 5% of the data points) at the upper end of the distrbution.
The result looks like this:

Apply Remove Outliers to all columns (A and B)
The settings applied in this case are:
- Remove outliers for Columns
AandB. - Mode: Percentile
- Percentile range: 0 … 95 for both columns
- Don’t remove data at the lower end of the distribution.
- Remove one data point (which is equivalent to 5% of the data points) at the upper end of the distribution.
The result looks like this:

The two white bars in the middle of each distribution is due to the outlier removed in the other column as each column is treated independently based.
If multiple columns are selected each column is analysed independently based on the original dataset before any data is removed. If the step would be created multipled times and working on a single column each time the resulting dataset would eventually (nearly) be the same.
Exception: If the same data point would be removed for multiple columns. In that case running all columns at once would result in a different dataset then applying Remove Outliers on each column separately as the starting point is already changed for later steps (the later step doesn’t see the original dataset anymore).
If you apply a percentile on one column only, the proportion of the data kept will be the one specified. So if you decide to keep the range 5% - 95%, then 90% of the data will be kept. However, if you apply that same filter on multiple columns (that is removing 10% from each column), it is likely that more than 10% will be removed overall. To check this, you can see how much of the data was removed overall.
Was this article helpful?
That’s Great!
Thank you for your feedback
Sorry! We couldn't be helpful
Thank you for your feedback
Feedback sent
We appreciate your effort and will try to fix the article